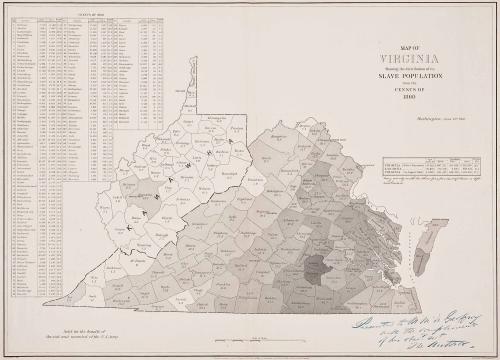
Map of Virginia Showing the distribution of its Slave Population from the Census of 1860 Washington, June 13th 1861
Date1861
Maker
Edwin Hergesheimer
MediumLithograph
DimensionsOH: 22 7/8" X OW: 29 1/4"
Credit LineGift of Mr. and Mrs. Richard F. Barry, III, Mr. and Mrs. Macon F. Brock, Mr. and Mrs. David R. Goode, Mr. and Mrs. Conrad M. Hall, Mr. and Mrs. Thomas G. Johnson, Jr., Mr. and Mrs. Charles W. Moorman, IV, and Mr. and Mrs. Richard D. Roberts.
Object number2017-243
DescriptionUpper right corner reads: "MAP OF/ VIRGINIA/ Showing the distribution of its/ SLAVE POPULATION/ from the CENSUS OF/ 1860/ Washington, June 13.th 1861"Bottom left corner: "Sold for the benefit of'/ of the sick and wounded of the U.S. Army."
Inscription in iron gall ink below right-hand key: "Every county with less than five per cent of slaves is left/ unshaded."
Inscription in blue pencil bottom right corner: "Presented to M.' M.' de Geoffrey/ with the compliments/ of his obed.t sev.t/ The Author.
Label TextThis map is a choropleth map, which was relatively new technology at the time. A choropleth map uses shading or coloring to indicate different values of a data variable in defined regions, such as counties. In this case the data represented is the distribution of enslaved populations according to the 1860 census. Darker areas show the areas in which the economy relied more heavily on enslaved labor. At the lower left of the map is the claim that it was "Sold for the benefit of the sick and wounded of the US Army." This copy of the map was owned by someone that knew mapmaker Edwin Hergesheimer personally, as indicated by a handwritten inscription that reads "Presented to M.' M.' de Geoffrey with the compliments of his obedt. sert. the author." Hergesheimer's map, which was published alongside a similar map of the southern states, is considered the first effort to geographically represent the population density of slavery.
This copy appears in William C. Wooldridge, "Mapping Virginia: From the Age of Exploration to the Civil War" (Charlottesville: University of Virginia Press, 2012), 147-149.
ca. 1865
Probably 1832-1835

1779 (dated)
1827
1824-1828 (range of the entires in the album).